
Published 9 October 2026, Updated 9 October 2026
Both tabs are available only with Can manage course responsible by batch.
Resources Stats tab
Resources Stats has two parts: Actually, a current snapshot, and a historical part controlled by the From date range.
Actually: current availability
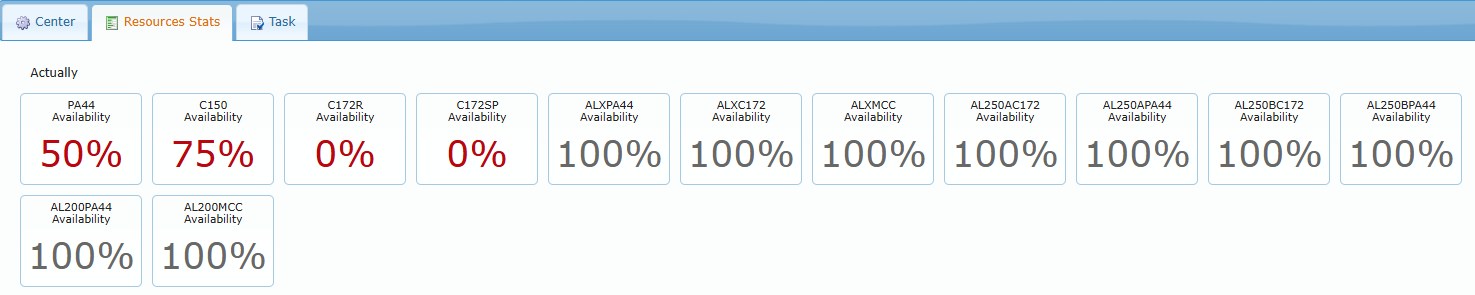
Each box shows, for one resource type, the percentage of active resources that are currently available according to the latest resource status. A value at or below the threshold set by your organization is shown in red and blinks.
- Hover a box for the resource type name and description.
- Select a box to open the maintenance statistics page.
This snapshot is not affected by the date range below it.
Choose the historical period
The From range starts on January 1 of the current year and ends today. Select it to choose a preset or a custom range, then apply it. Future dates are not available.
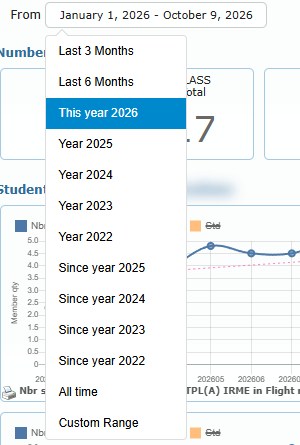
| Preset | Period |
|---|---|
| Last 3 Months / Last 6 Months | The last complete months, up to the end of last month. |
| This year | January 1 to December 31 of the current year. |
| Year YYYY | One previous calendar year. |
| Since year YYYY | From January 1 of that year to today. |
| All time | Every recorded date. |
| Custom Range | Any start and end date you choose. |
Number of resources
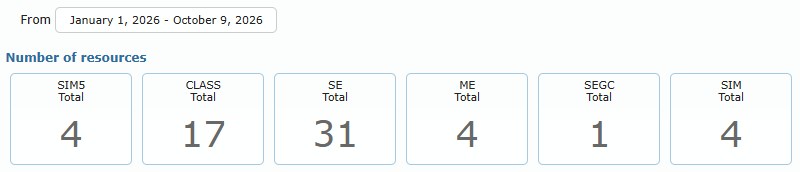
Each box counts the distinct resources of a category that were used during the period. Hover a box for the breakdown by type; select it to open the maintenance statistics page.
Students per Instructor Allocations
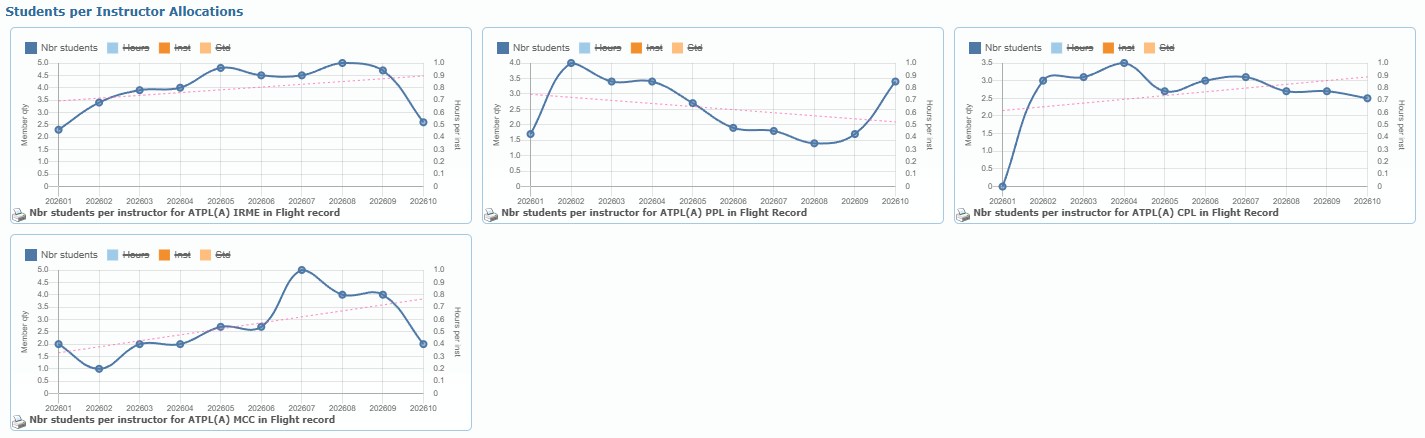
Each chart follows one training activity configured by your organization (its title is written under the chart). The Nbr students line is the number of participating students divided by the number of participating instructors. Select Hours, Inst or Std in the legend to show the hours per instructor, the number of instructors or the number of students. The dotted line shows the trend. Use the small printer icon to print a chart.
Instructor activities performance
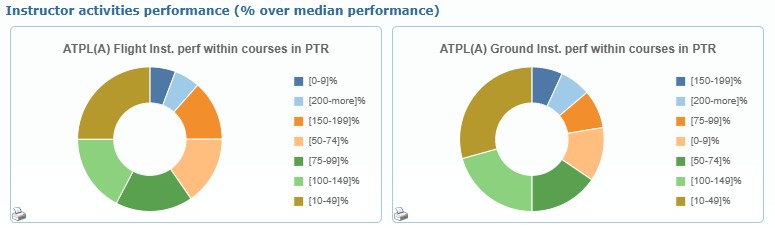
Each doughnut groups instructors by their recorded activity compared with the median of the organization (100%). Hover a slice to read the number of instructors in that band.
These charts have the same meaning as in the Resources tab of Responsible analytics. They describe activity volume, not instructor quality.
Task tab
Task lists the follow-up tasks of the Course responsible Center. It is not filtered by the responsible members or courses visible on the board.
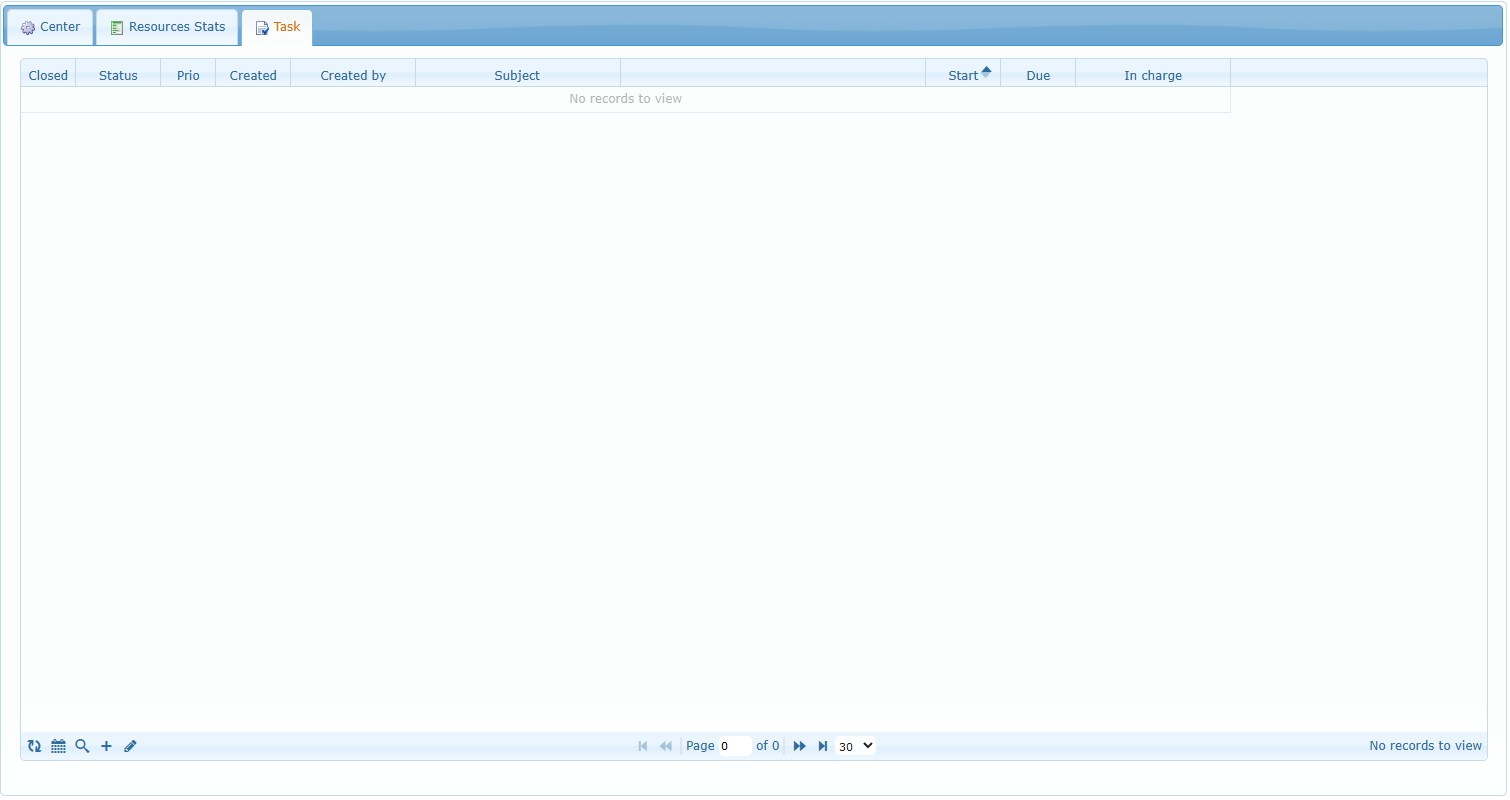
Use it for work such as assigning an unassigned course, reviewing an overloaded responsible member, following up a course note or correcting an assignment. Creating, assigning, filtering, closing and recurring tasks work as described in the Tasks and Task Center chapter.
If a task disappears, change the Closed filter to All or Closed.