Published 25 October 2026, Updated 25 October 2026
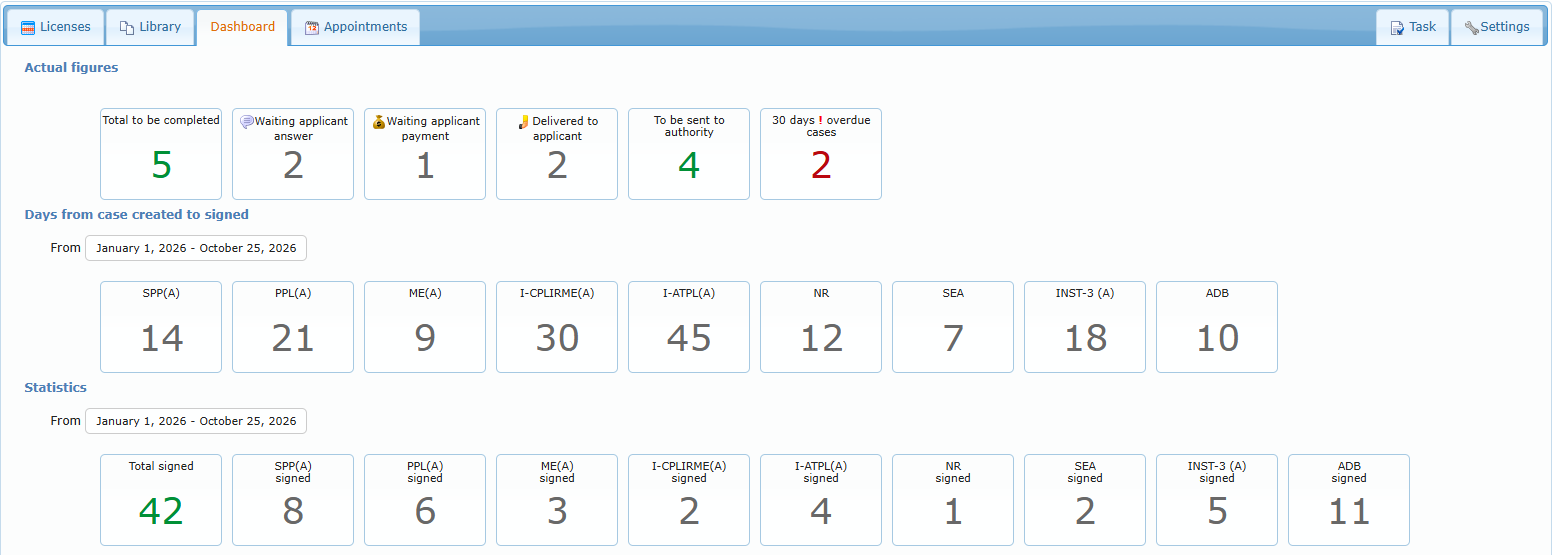
The Dashboard gives a live view of the activity:
- Actual figures: Total to be completed, the number of cases in each status, To be sent to authority and the overdue cases (open, not completed, older than the overdue delay). Hover a box to see the numbers by case type.
- Days from case created to signed: the average number of days between creation and signature, by case type, for the chosen period.
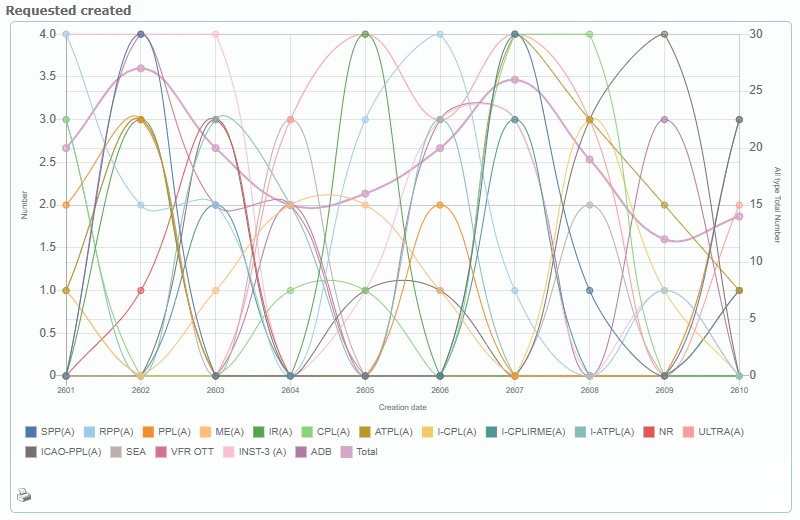
- Statistics: the number of cases signed in the period (total and by case type), and two charts: cases created by month and by year (one line per case type plus the total).
Choose the period with the date button (this year by default; quick choices such as last month, last 3 or 6 months, a given year, since a year, all time). Each chart has a print icon.