
Published 11 October 2026, Updated 11 October 2026
Safety Performance Indicators are data-based measures used to monitor safety performance against your safety objectives. The SPI tab computes them automatically from the event reports, hazard reports and flight activity.
Choose the period with From (default: since January 1st). The printer icon prints the page.
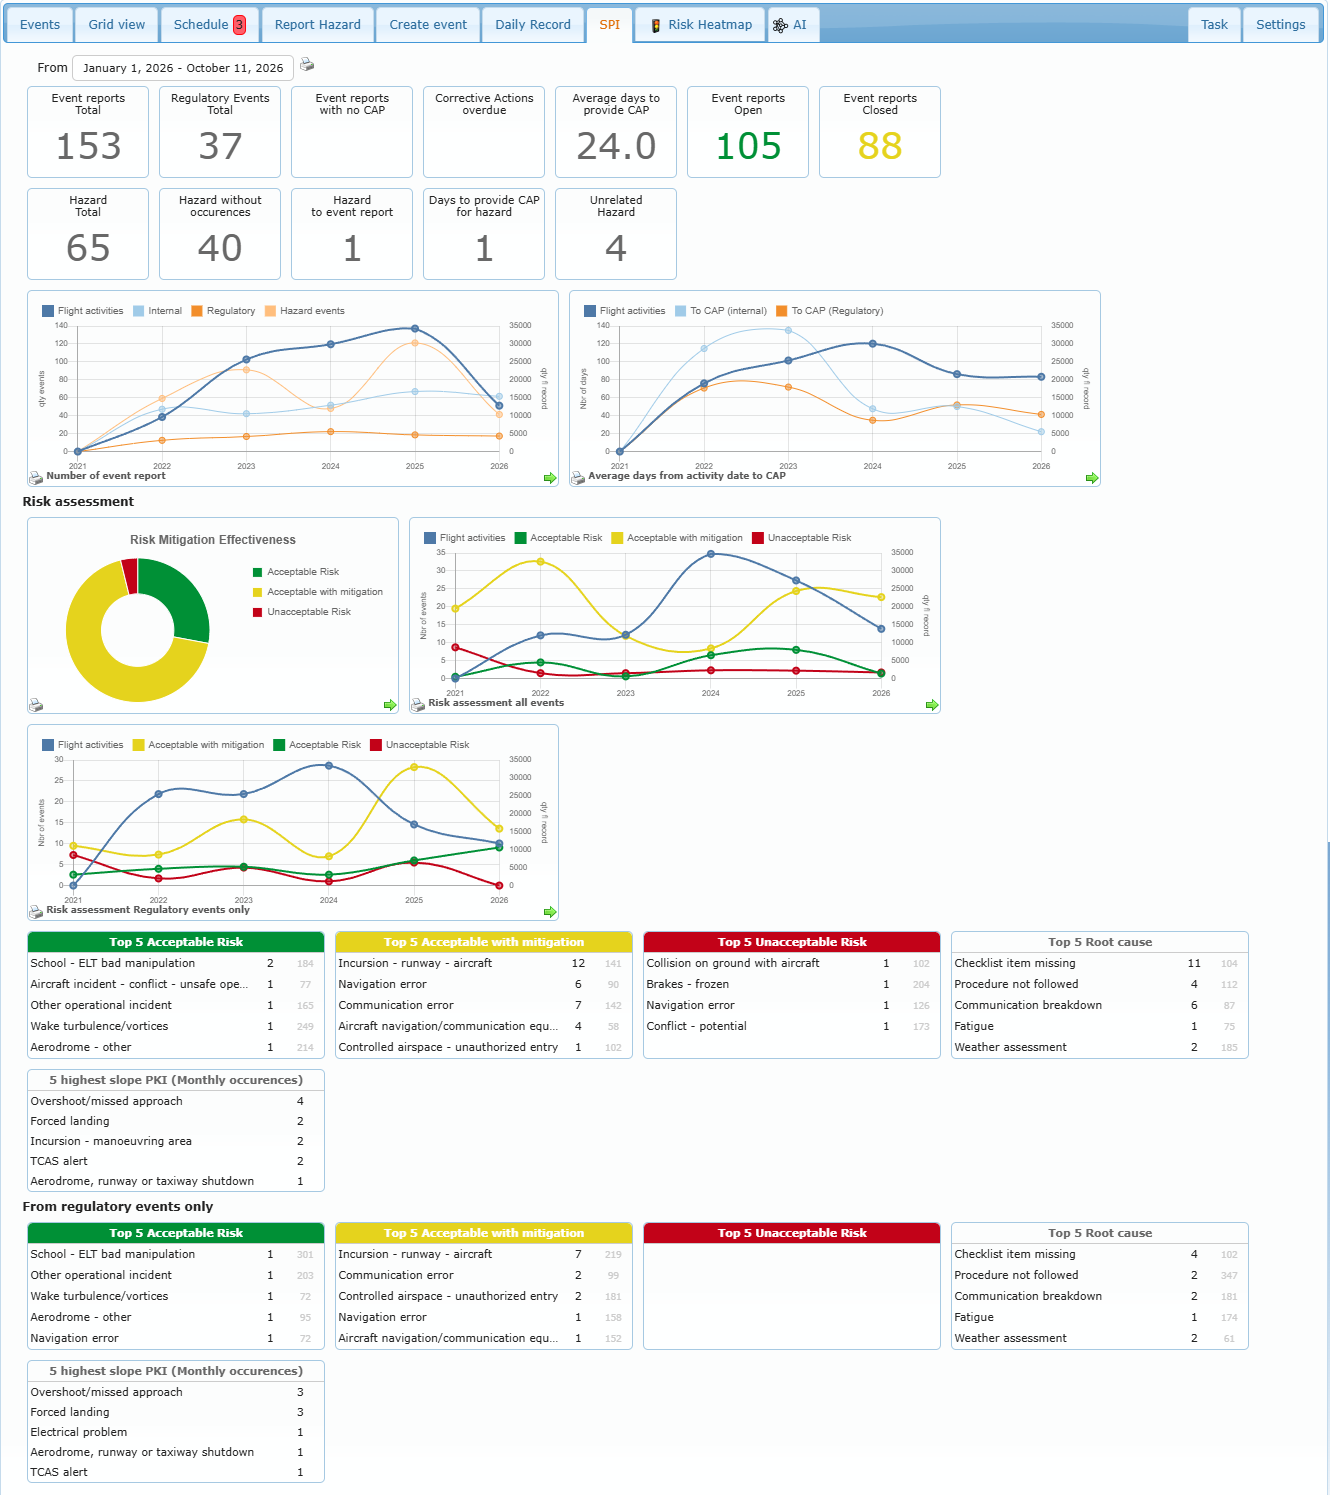
| Indicator | Meaning |
|---|---|
| Event reports Total / Regulatory Events Total | Number of event reports / of those with a regulatory reference. |
| Event reports with no CAP | Reports without a corrective action plan. |
| Corrective Actions overdue | Scheduled actions past their projected date. |
| Average days to provide CAP | Average time from the activity to the corrective action plan. |
| Event reports Open / Closed | SMS files open / closed. |
| Hazard Total, Hazard without occurrences, Hazard to event report, Days to provide CAP for hazard, Unrelated Hazard | Hazard reporting indicators. |
Charts
| Chart | What it shows |
|---|---|
| Number of event report | Reports per year (internal, regulatory, hazard events) compared with the flight activity. A rising number of reports with stable activity can mean more events, or a better reporting culture: look at the risk charts before concluding. |
| Average days from activity date to CAP | How fast corrective action plans are provided, for internal and regulatory events. |
| Risk Mitigation Effectiveness | Share of events in each risk zone (acceptable, acceptable with mitigation, unacceptable). |
| Risk assessment all events / Regulatory events only | Number of events in each risk zone per year, compared with the flight activity. |
Click the small arrow of a chart to open it bigger, the printer icon to print it.
Top 5 tables
The Top 5 tables list the most frequent occurrence categories in each risk zone and the most frequent root causes, for all events and for regulatory events only. 5 highest slope PKI (Monthly occurrences) lists the categories whose monthly number of events increases the fastest; hover over the value to see the trend details. The light grey number at the right of a line is the number of days without an event of that category.
When to use it: at the safety review meeting, to check the objectives of your safety policy, follow the indicators over the years, and decide where to act first (unacceptable risks, fast-growing categories, recurring root causes).